Exposing metrics to Prometheus with Service Monitors

You’ve done the hard part and added instrumentation to your application to gather metrics, now you just need to expose those metrics to Prometheus so you can alert on them and monitor them, easy right?

Fry’s not sure that exposing metrics to Prometheus is easy
Why use a Service Monitor?
If you don’t have to access to your Prometheus configuration file (if for example you don’t manage your Prometheus deployment) you can’t simply add metric endpoints to Prometheus, you will need to create a target that the Prometheus operator can discover and add to the Prometheus configuration: one way to achieve this is via configuring a service monitor to expose your metric endpoints.
Service Discovery

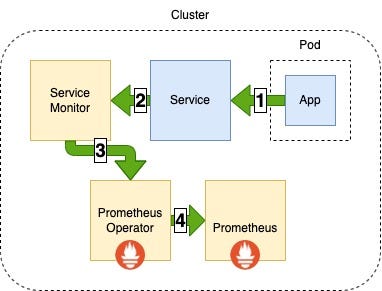
Service monitor metric endpoints service discovery
1 Metrics endpoint exposed by a running application in a pod is mapped to a service.
2 Metrics endpoint mapped to a service is exposed by the service to a service monitor.
3 The Prometheus operator discovers the endpoints exposed by the service monitor.
4 The Prometheus operator updates the Prometheus configuration to include the endpoints exposed by the service monitor, Prometheus will now scrape metrics from these endpoints
How to expose metrics with a Service Monitor
Creating a service monitor is as simple as adding a configuration file to the templates directory of your projects Helm chart.
Your service should look something like the example below: you should expose the port your metrics endpoints are mapped to within your pods (in my case 8080) and give your service a label so that your service monitor can find the service.
service.yaml
---
apiVersion: v1
kind: Service
metadata:
  name: service
  labels:
    name: service
spec:
  ports:
    - name: https
      port: 10443
      protocol: TCP
      targetPort: 10443
    - name: metrics
      port: 8080
      protocol: TCP
      targetPort: 8080
  selector:
    application: myApplication
As in the example below configure your service monitor with the port your service exposes your metrics on (and the path to those metrics on that port which you will have set whilst implementing the instrumentation to gather these metrics) and set the selector to match the service from the previous step.
service-monitor.yaml
apiVersion: monitoring.coreos.com/v1
kind: ServiceMonitor
metadata:
name: service-monitor
labels:
application: myApplication
spec:
endpoints:
- interval: 30s
path: /prometheus
port: *metrics*
selector:
matchLabels:
name: *service*
Now deploy your helm chart and you should see your service monitor (and your new service if you have created one) have been deployed.
hughevans@MacBook-Pro ~ % kubectl get services
NAME      TYPE       CLUSTER-IP       PORT(S)               AGE
service   ClusterIP  ***.**.***.***   10443/TCP,8080/TCP    1m
hughevans@MacBook-Pro ~ % kubectl get servicemonitors
NAME                                      AGE
service-monitor                           1m
Wait for the Prometheus Operator to discover the new Service Monitor: once it has done this you will see your new service monitor appear as targets in the Prometheus web UI.
Troubleshooting
Prometheus has discovered the service monitor but not the metrics endpoints associated with it
Most issues with service monitors can be traced to a misconfiguration of selectors in the service monitor config file: try using kubectl to compare the name label in your service and to the selector in your service monitor to make sure they are set correctly.
Endpoints appear as down when viewed from Prometheus web UI
Check to ensure that your service is exposing the correct port: you may have exposed the standard HTTP port instead of the metrics port for example. Prometheus will assert that an endpoint is down if it does not receive a valid Prometheus response from it when it attempts to scrape metrics.
You may also see this issue if your metrics port is using HTTPS or requires authenticated requests.
Further reading
Troubleshooting service monitors
Exposing metrics to Prometheus with Service Monitors was originally published in daemon-engineering on Medium.
